
Spatio-Temporal Modeling of the Rio de Janeiro Bus Network
PostgreSQL · PostGIS · Python · Folium
This data mining project aims to build the database necessary for training a prediction model for Rio de Janeiro bus locations. Starting with raw and highly noisy GPS data emitted by thousands of buses, the challenge was to design spatial algorithms to clean the data, infer the city’s infrastructure (automatic identification of depots and terminals), separate trips by direction of travel, and finally calculate a speed model segmented into 250-meter sections. This work transformed a chaotic GPS stream into a structured, usable training dataset.
Context
This project was completed during my academic exchange at UFRJ (Federal University of Rio de Janeiro) in Brazil. It serves as the final evaluation project for the Data Mining course taught by Professor Geraldo Zimbrao. The challenge was to face the reality of urban data (open data), which is often incomplete or aberrant, and to apply data mining methods at a large scale.
Data
- Source and Volume: Over 50 GB of data from onboard GPS sensors, collected over 16 continuous days (from April 25 to May 10, 2024). The dataset covers 48 bus lines and 2,711 unique vehicles.
- Key Variables:
ordem(Unique bus identifier),linha(Line number).latitude/longitude(WGS84 coordinates),velocidade(Instantaneous speed).datahora(Transmission time) anddatahoraservidor(Server reception time, considered the most reliable to avoid desynchronization).
- Exploratory Analysis: The raw data was highly noisy:
- 34% of GPS points recorded zero speed (stopped or parked buses).
- Aberrant points located physically outside the city of Rio.
- Inconsistent speeds.
Methodology
To transition from isolated GPS points to a continuous speed model, the pipeline was structured into 4 main engineering phases:
Phase A: Geospatial Cleaning and Filtering
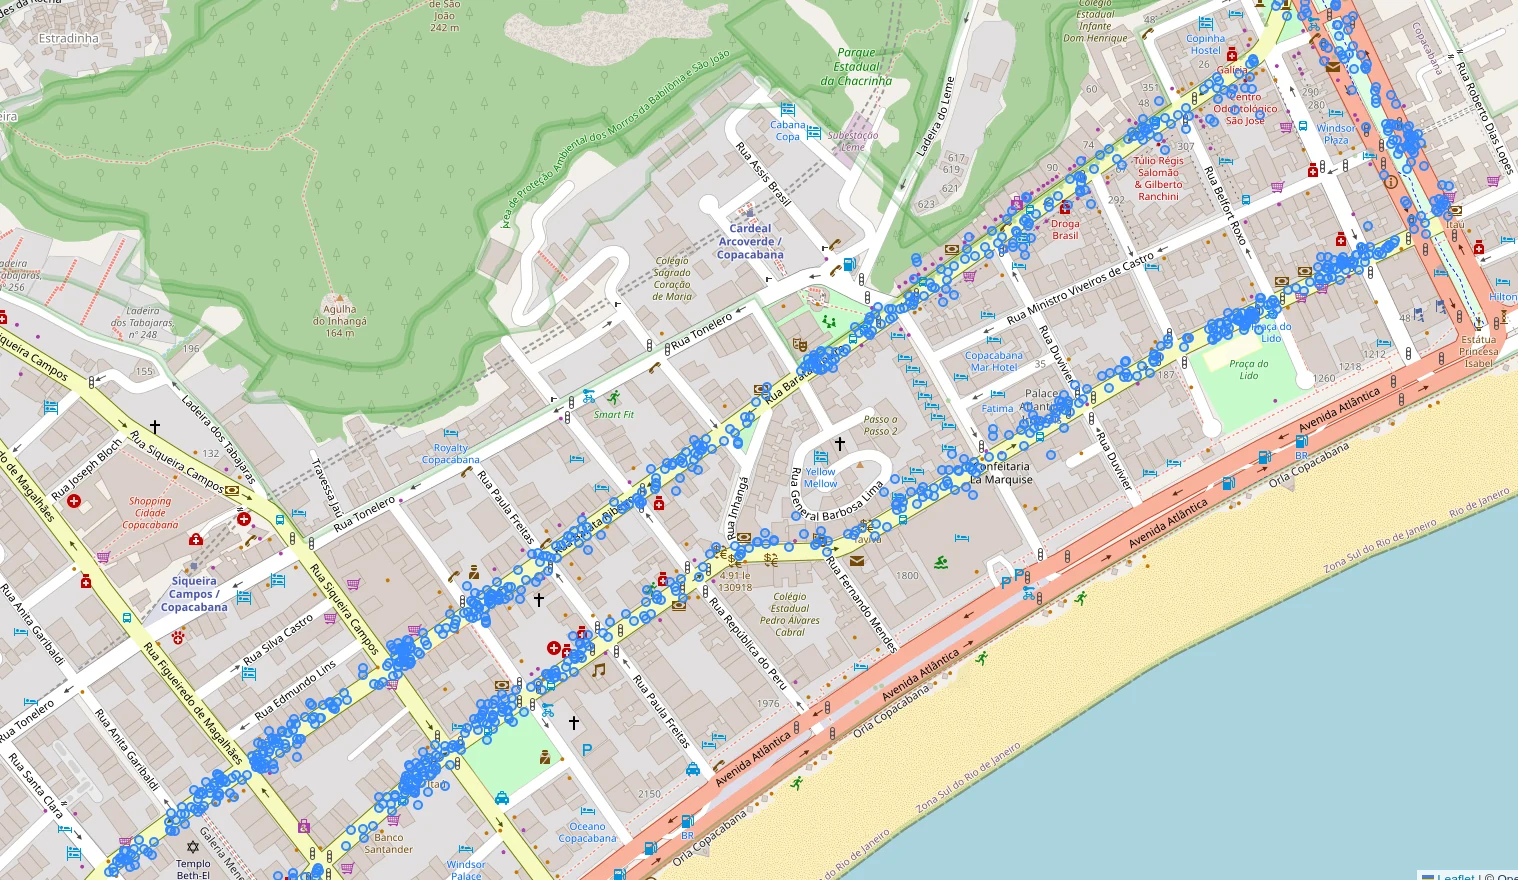
Removal of anomalies via PostGIS queries (excluding coordinates outside a bounding box of Rio, filtering out absurd speeds, and restricting the time window to 8:00 AM to 11:00 PM).
Phase B: Algorithmic Infrastructure Detection (Temporal Clustering)
Since the computer did not know the city map, it was necessary to infer points of interest by analyzing behaviors:
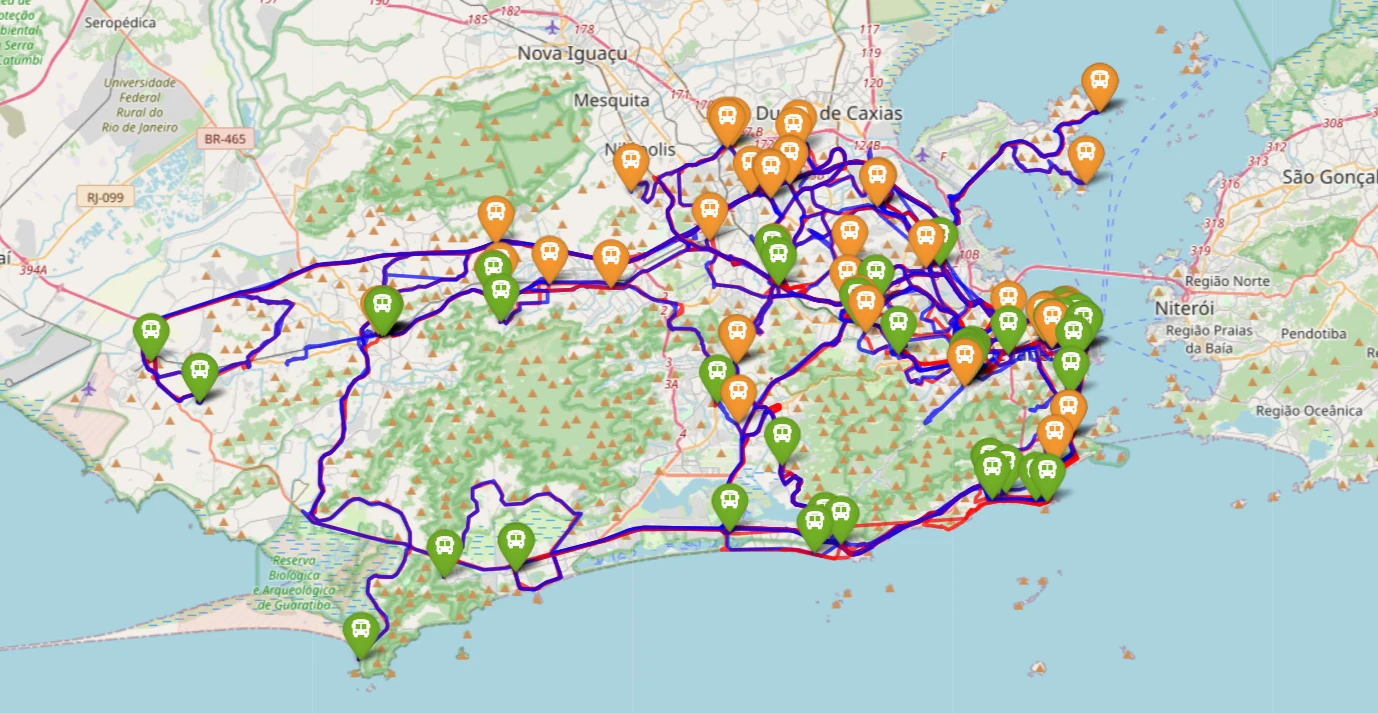
- Depot Detection: Identification of prolonged stops (over 10 minutes) taking place early in the morning. To avoid duplicates, a mutual exclusion filter with a 50-meter radius was applied. Trips to/from these depots (which skew real travel times) were then excluded.
- Terminal Detection: Counting frequent stops of 10 to 30 minutes at the same geographical location. This method proved extremely reliable for automatically identifying both ends of each line (validated visually on Folium maps).
Phase C: Routing and Interpolation (Direction of Travel)
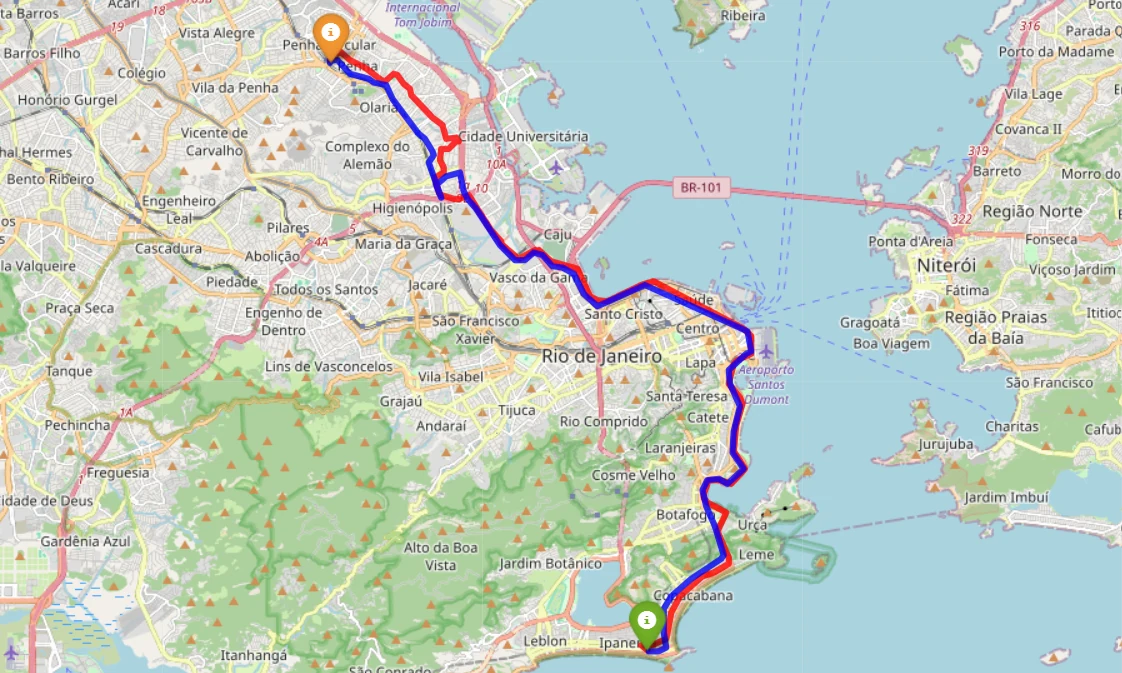
With the terminals identified, each GPS point cloud could be divided into inbound and outbound trips.
Since GPS points are sent at regular intervals, a fast-moving bus leaves large gaps on the map. Mathematical interpolation was applied to reconstruct the exact reference route between GPS pings. (Note: Targeted manual intervention was required to correct lines 606 and 917, where one terminal was actually an eccentric depot).
Phase D: Speed Modeling by Section and Feature Engineering
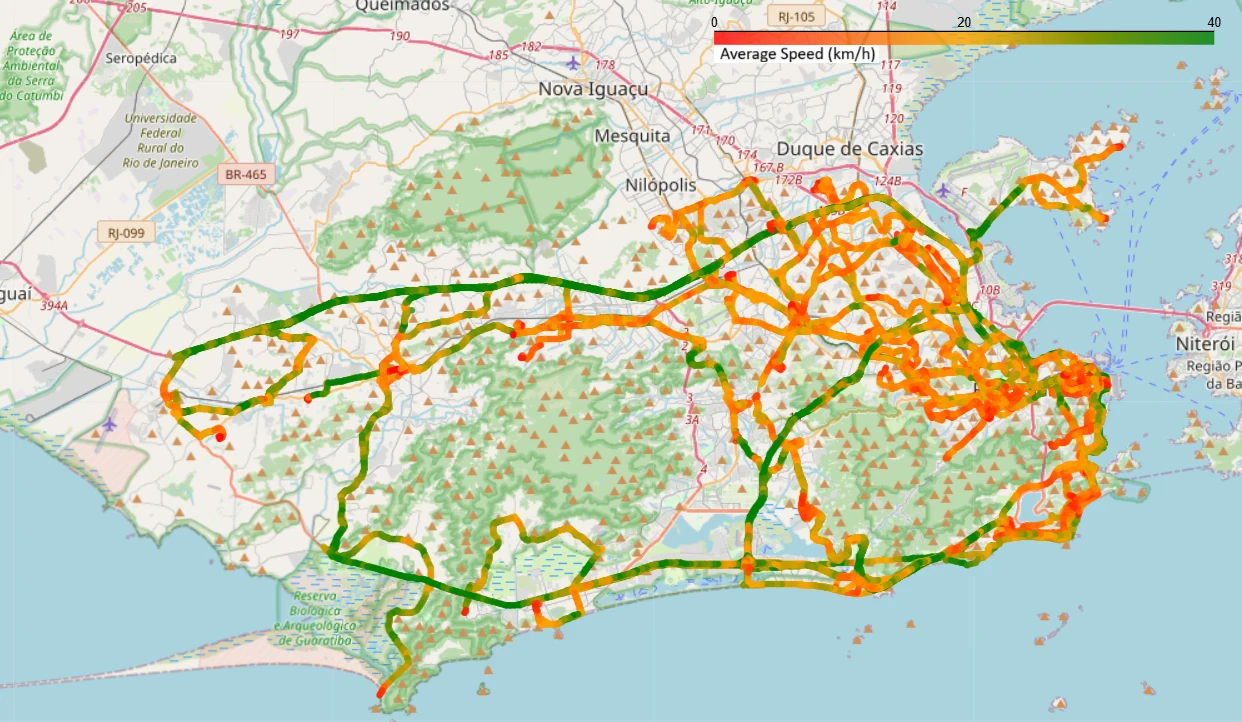
Reference routes were split into sections (segments) of approximately 250 meters. An algorithm calculated the historical average speed for each section, line by line (since a given boulevard is not traversed at the same speed depending on the specific stops of a line).
Results
The pipeline was successfully run on all 48 lines in the city. The speed model was visually validated via Folium maps overlaying the colored sections.
The outcome: The project generated the final feature matrix, ready to be used by a machine learning algorithm to predict a bus’s arrival time at a given point, including:
- Historical speeds and vehicle position.
- Remaining distance to travel on the reference line.
- Historical average speed of the upcoming road sections.