
Supermarket Sales Forecasting using Time Series
LightGBM · RandomForest · Time Series
This project aims to predict daily unit sales for thousands of items across 54 stores of the Corporación Favorita supermarket chain in Ecuador. The central challenge lies in harmoniously integrating heterogeneous external signals (oil price fluctuations, regional earthquakes, holidays, paydays) to improve predictions. Through an iterative feature enrichment process, the model achieved a RMSLE score of 0.69857 in evaluation.
Context
This work was completed during my academic exchange at UFRJ (Brazil), as part of the Data Mining course taught by Mr. Geraldo Zimbrao. The industrial challenge is critical: accurate demand prediction helps limit stockouts while avoiding the waste of perishable products.
Data
To capture the full complexity of demand, the pipeline merges 6 distinct data sources:
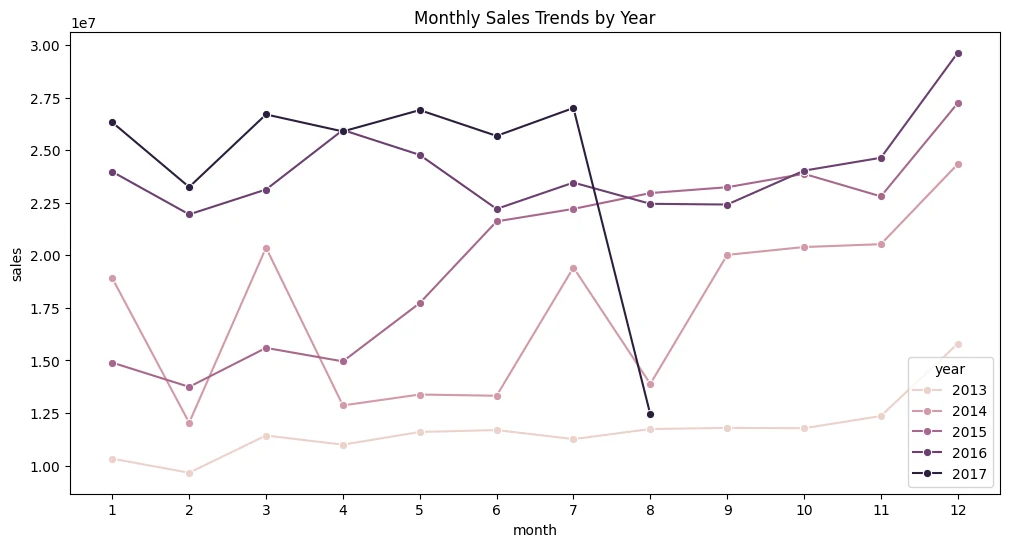
- Target Data: Historical unit sales and promotions from January 2013 to July 2017 (for 54 stores and 33 product families).
- Economic Data (Oil): Since the Ecuadorian economy is highly dependent on crude oil, its daily price has a direct impact on purchasing power. The dataset had 28.5% missing values (including weekends), which were corrected using linear interpolation.
- Calendar Data (Holidays): A complex database of holidays (local, regional, national) and major events (e.g., the impact of the April 2016 earthquake).
- Social Data (Paydays): Since public servants are paid on the 15th and the last day of the month, these dates generate consumption spikes that needed to be modeled.
Methodology
To isolate the impact of each data source, we adopted a scientific approach of progressive enrichment, validated on a single “pilot store” before scaling up.
Phase A: Baseline Model
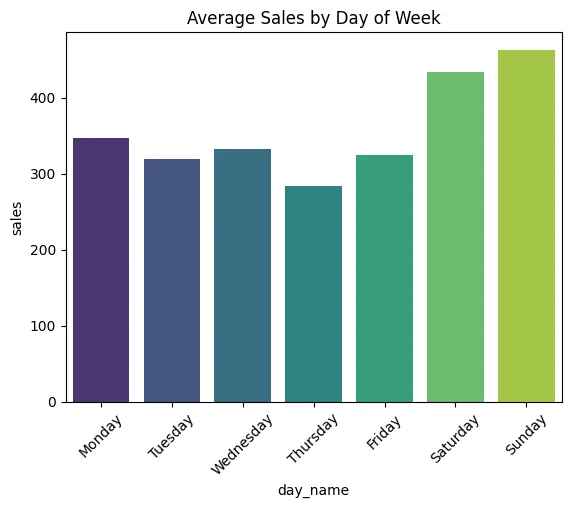
- Extraction of classic temporal components from the date (day of the week, day of the year, month).
- Creation of 30-day rolling variables to capture the intrinsic trend of each product family.
Phase B: Iterative Enrichment
- Adding Holidays: Creation of flags to alert the model to consumption spikes related to festivities.
- Adding Oil Prices: Injecting the smoothed barrel price to adjust the global macro-economic trend.
- Adding Paydays: Modeling the bi-monthly payday windows, an extremely strong signal in South American consumption habits.
Phase C: Algorithm Choice and Scaling Up
- Experiments: On the pilot store, RandomForestRegressor performed slightly better than LightGBM (RMSLE of 0.4956 vs 0.5674 on baseline data).
- The Scalability Wall: When scaling up to the national level (predicting all 54 stores * 33 product families simultaneously across millions of rows), the Random Forest algorithm collapsed, generating an Out-Of-Memory (OOM) error due to the depth and number of trees.
- Solution: Switched to LightGBM, a gradient boosting algorithm specifically designed to be extremely memory-efficient and fast on large datasets.
Results
Tracking the root mean squared logarithmic error (RMSLE) on the pilot store shows that each external data source provided an incremental predictive gain:
| Modeling Step | Added Features | RMSLE (Pilot Store) |
|---|---|---|
| 1. Baseline | Pure temporal variables | 0.4956 |
| 2. + Calendar | Holiday indicators | 0.4931 |
| 3. + Economy | Oil prices (interpolated) | 0.4737 |
| 4. + Social | Pay cycles (15th and end of month) | 0.4722 |
Final Assessment: Deployed across the entire national network (all stores and products combined), the final LightGBM model achieved a public score of 0.69857 on Kaggle. The mechanical increase in RMSLE during this final phase is explained by the explosion in complexity and variance induced by predicting stores and items with very disparate behaviors.