
Obesity Risk Classification using Machine Learning
XGBoost · GridSearchCV · Feature Engineering
This project aims to classify individuals into 7 obesity risk categories (ranging from Underweight to Type III Obesity) based on 17 physical and behavioral variables. Faced with a multi-class classification problem, we implemented a benchmark comparing various learning algorithms (from KNN to XGBoost). The major insight of the project was demonstrating that engineering a simple domain-specific feature (the calculation of the Body Mass Index) drastically improved the performance of the best model (XGBoost), achieving an accuracy of 0.90715 on the test set.
Context
This work initiates the series of projects completed during my academic exchange at UFRJ (Brazil) for the Data Mining course taught by Professor Geraldo Zimbrao. It is based on a competition hosted on the Kaggle platform (Obesity Risk Classification). The goal was to apply a strict predictive modeling methodology to public health data: from exploratory data analysis (EDA) to fine hyperparameter tuning.
Data
- Data Quality: The provided dataset was exceptionally clean, containing no missing values in either the training or test sets.
- The Variables: 17 features combining numerical and categorical data.
- Physical Criteria: Age, Height, Weight, Gender, Family History.
- Dietary Habits: Vegetable consumption frequency (FCVC), number of meals (NCP), water consumption (CH2O), high-calorie food consumption (FAVC).
- Lifestyle Habits: Physical activity frequency (FAF), screen time (TUE), primary mode of transport (MTRANS).
- The Target:
NObeyesdad, a discrete variable divided into 7 unbalanced classes (with theObesity_Type_IIIclass being slightly overrepresented in the training set).
Methodology
The pipeline was structured around a funnel approach: explore, compare, and then optimize.
Phase A: Exploratory Data Analysis (EDA)
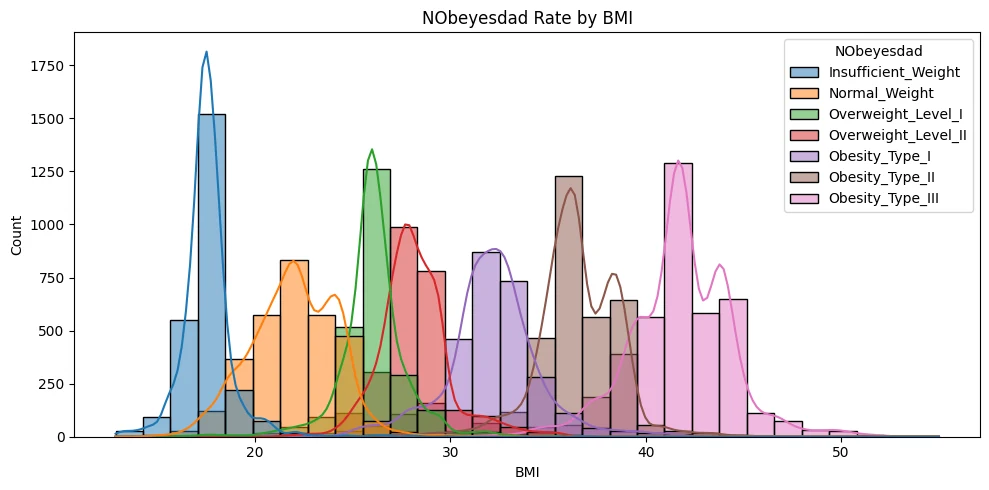
Correlation analysis immediately revealed that the Weight variable was highly predictive. However, from a clinical standpoint, weight alone does not define obesity without being related to height.
Phase B: Feature Engineering
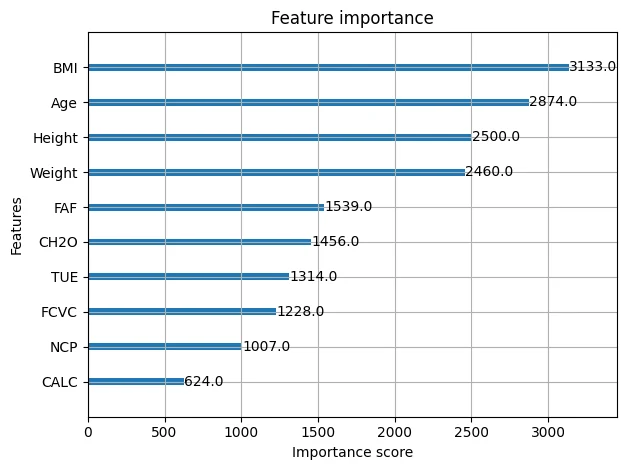
Addition of a new synthetic variable: BMI (Body Mass Index), calculated mathematically from height and weight. Once injected into the models, feature importance analysis revealed that BMI instantly ranked as the number 1 predictive variable, ahead of all lifestyle habits.
Phase C: Benchmark of Classification Models
After encoding categorical variables and normalization, 5 algorithms were compared in cross-validation:
- KNN (K-Nearest Neighbors): 0.7625
- Logistic Regression: 0.8603
- SVM (Support Vector Machine): 0.8617
- Random Forest: 0.8985
- XGBoost: 0.9023 (Winner)
Phase D: Hyperparameter Optimization
The XGBoost model was refined via hyperparameter search to maximize generalization and prevent overfitting.
- Best parameters found:
learning_rate(0.1),max_depth(5),n_estimators(200),subsample(0.7),colsample_bytree(0.7). - Accuracy after optimization: 0.9070.
Results
The final training was performed on 100% of the available training data before submitting the predictions to Kaggle.
| Model | Domain Addition | Public Kaggle Score | Private Kaggle Score |
|---|---|---|---|
| KNN | Baseline | 0.7625 | - |
| Logistic Regression | Baseline | 0.8603 | - |
| SVM | Baseline | 0.8617 | - |
| Random Forest | Baseline | 0.8985 | - |
| Optimized XGBoost | + BMI Feature | 0.91257 | 0.90715 |
Lesson Learned: This project demonstrates that in data science, understanding the problem takes precedence over algorithmic brute force. Transforming simple height and weight columns into a clinical indicator (BMI) was the most powerful improvement lever of the entire pipeline.